Professional Supplier of Laboratory Scientific Instruments
Professional Supplier of Laboratory Scientific Instruments
USP-7500X double beam UV-visible spectrometer has a bandwidth resolution as low as 0.3nm and a wavelength resolution as high as 0.05nm, which can meet the needs of daily laboratory analysis, research and analysis in scientific research institutes, etc.
| Model | USP-7500X |
| Optical system | Optical double beam (non-proportional double beam) |
| Photometric method | transmittance, absorbance, energy |
| Wavelength range | 190nm~1100nm |
| Spectral bandwidth | 0.5/1.0/2.0/4.0/5.0nm (0.3nm is optional) |
| Wavelength accuracy | ±0.3nm |
| Wavelength repeatability | ≤0.2nm |
| Wavelength setting | Automatic wavelength setting, wavelength resolution 0.05nm |
| Absorbance range | 0~300%T, -3~3A |
| Photometric accuracy | ±0.002A (0~0.5A), ±0.004A (0.5~1A), ±0.3%A (0~100%T) |
| Photometric repeatability | ≤0.001A (0~0.5A), ≤0.002A (0.5~1A), ≤0.15%A (0~100%T) |
| Stray light | ≤0.03% |
| Transmittance range | 0~300.0 % |
| Transmittance accuracy | ≤±0.3% |
| Transmittance repeatability | ≤0.1% |
| Baseline drift (stability) | ≤0.0005Abs/h(0.1%/h) |
| Noise | ±0.05%T(0%T line), ±0.1%T(100%T line) |
| Baseline straightness | ≤±0.0008Abs |
| Scanning speed | High/medium/low adjustable |
| Detector | Imported silicon photodiode |
| Light source | Long-life deuterium lamp, halogen tungsten lamp (optical debugging free); support third-party light source replacement |
| Display | Can be equipped with a large color tablet display of more than 10 inches |
| Data interface | Support USB/Bluetooth communication |
| Print output | Support printers that can install drivers |
| Operating environment | Support Windows/Android operating platform |
| Power supply | AC90-250V, 50/60Hz |
| Dimensions | 550*460*220mm |

Photometric mode
- Get test results by setting a specified wavelength
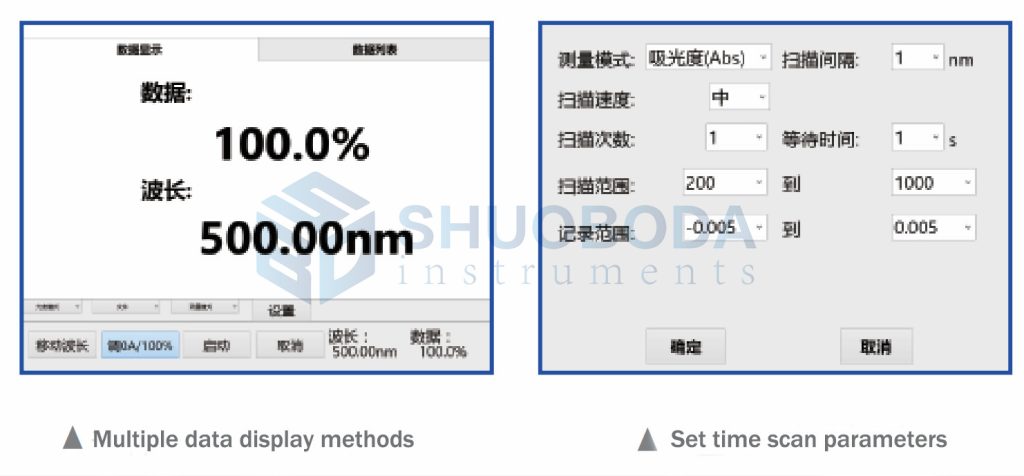
- Multiple data display modes: large mode/list
Wavelength scanning mode
- Get spectra by setting a specified wavelength range and other corresponding parameters
- Comprehensive spectrum processing functions: peak and valley detection/smoothing/derivative, T/A conversion, etc.
Time scanning mode
- Get trend charts by setting a certain time range

Quantitative analysis mode
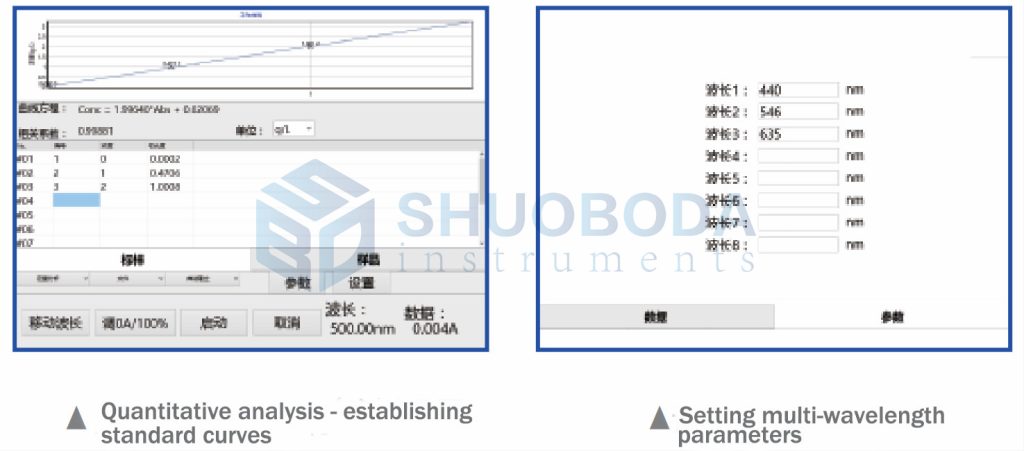
- Establish a working curve through known samples to obtain the absorbance of unknown samples and their corresponding concentrations
- Built-in multiple fitting curve types: linear curve/quadratic curve/cubic curve/
broken line
Multi-wavelength mode
- Get test values of each point of the sample by setting multiple wavelengths
- The test values can be obtained by custom arithmetic formulas
Experienced service team and strong production support team provide client worry-free order service.


If you are interested in any of our products or would like to discuss a customized order, Please feel free to contact us.
Contact Us