Professional Supplier of Laboratory Scientific Instruments
Professional Supplier of Laboratory Scientific Instruments
USP-1901 series Double beam UV-visible spectrophotometer can be used for scientific research in physics, chemistry, medicine, biology, pharmacology, geology and other disciplines. It is one of the important quality control instruments widely used in chemical industry, pharmaceuticals, metallurgy, light industry, materials, environmental protection, medical testing and other industries and analytical industries.
1. Uniquely designed optical system, 1600 lines/mm high-performance long-life holographic grating, and imported high-performance receiver ensure that the instrument has excellent performance indicators.
2. Imported environmentally friendly deuterium lamp system, effectively reducing the inhalation of ozone;
3. Advanced control system, new generation true color touch LCD display, can monitor the lighting time of deuterium lamp and tungsten lamp in real time;
4. Socket-type deuterium lamp and tungsten lamp design, can save you the trouble of optical debugging after changing the lamp;
5. Large sample chamber, can accommodate 5-100mm cuvettes of various specifications;
6. Can directly send test results, print spectra and experimental data;
7. GLP self-identification function, can detect the wavelength accuracy and photometric accuracy of the instrument at any time according to needs, and issue a test report;
8. Powerful storage function, can save various types of data and spectra; memory 1T;
9. Standard GMP audit tracking workstation professional scanning software can realize a variety of powerful functions including photometric measurement, quantitative analysis (including standard curve function), full wavelength spectrum scanning, kinetic (time) scanning, multi-wavelength testing, etc., fully meet the diverse requirements of testing and unlimited data storage.
| Model | USP-1901P | USP-1901C |
| Optical system | 1600 lines/mm CT type optical path Enhanced double beam UV-visible spectrophotometer | |
| Slit bandwidth | 0.3/1/2/4/5nm (5 steps automatically adjustable) | |
| Wavelength range | 190-1100 nm | |
| Wavelength resolution | 0.1 nm, Optical focal length 350mm | |
| Data display | 8-inch new generation true color touch LCD display (two-way operation: host + PC workstation) | 320*240 LCD display (two-way operation: host + PC workstation) |
| Wavelength accuracy | ±0.1nm (@656.1nmD2, ±0.3nm (full wavelength range)) Actual measurement ±0.2nm | |
| Wavelength repeatability | ≤0.2nm | |
| Scanning speed | High, medium and low three gears optional 4100nm/min | |
| Stray light | ≤0.02%T (220nm Nal; 360nm NaNO2) | |
| Photometric range | 0-200%T, -0.301-6.0A, -9999-9999C | |
| Photometric accuracy | ±0.002A (0-0.5A), ±0.3%T (0-100%T) | |
| Photometric repeatability | ±0.001A (0-0.5A), ±0.15%T (0-100%T) | |
| Baseline flatness | ±0.0005A | |
| Baseline drift | ±0.003A/h | |
| Photometric noise | ±0.0003A (500nm, 0A, 2nm spectral bandwidth) | |
| Data output | U disk data output, PDF. excel. | |
| Language | English | |
| Power supply | AC 90-240V 150W | |
| Detector | Imported photomultiplier tube | |
| Weight | 25 kg | |
| Dimensions | 600*500*210mm | |
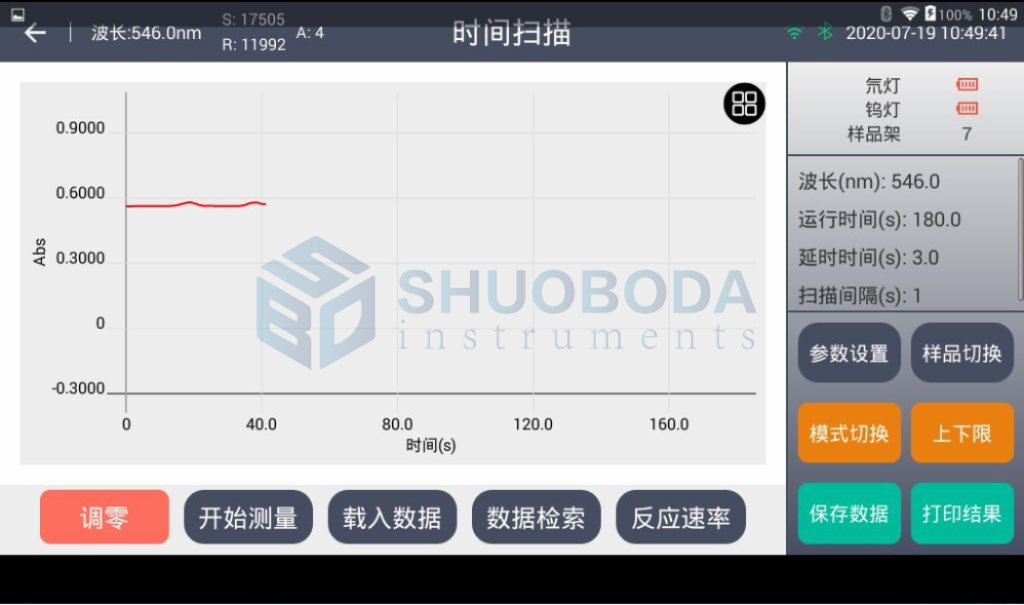
Time scan - kinetic measurement is also called time measurement. The user can measure the absorbance or transmittance of the sample solution at intervals (scanning intervals) within a certain scanning time range according to the sample set wavelength point, and can also convert the absorbance into concentration by inputting the concentration factor.
You can set a single wavelength absorbance or transmittance time scan to establish an absorbance (or transmittance)-time curve.
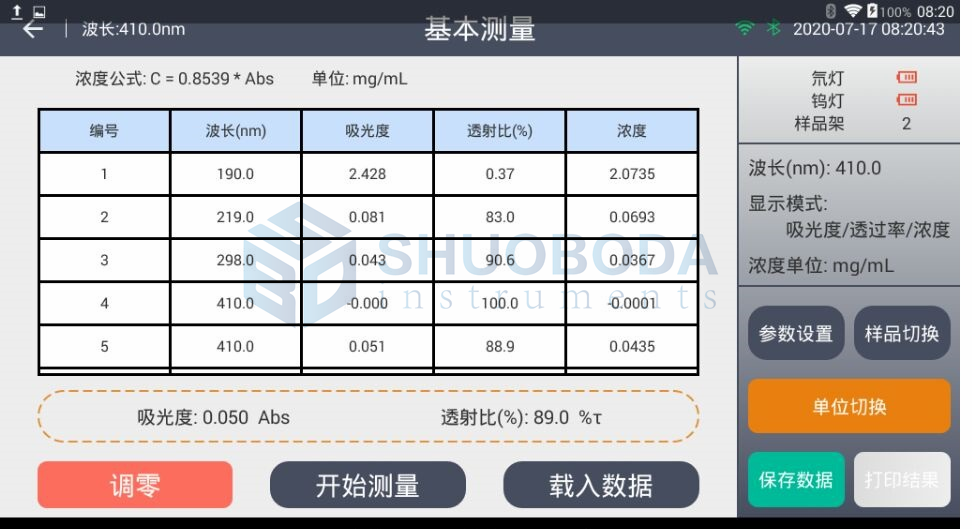
Basic measurement: Input wavelength to test the sample content value at the wavelength, and input sample content to test unknown samples.
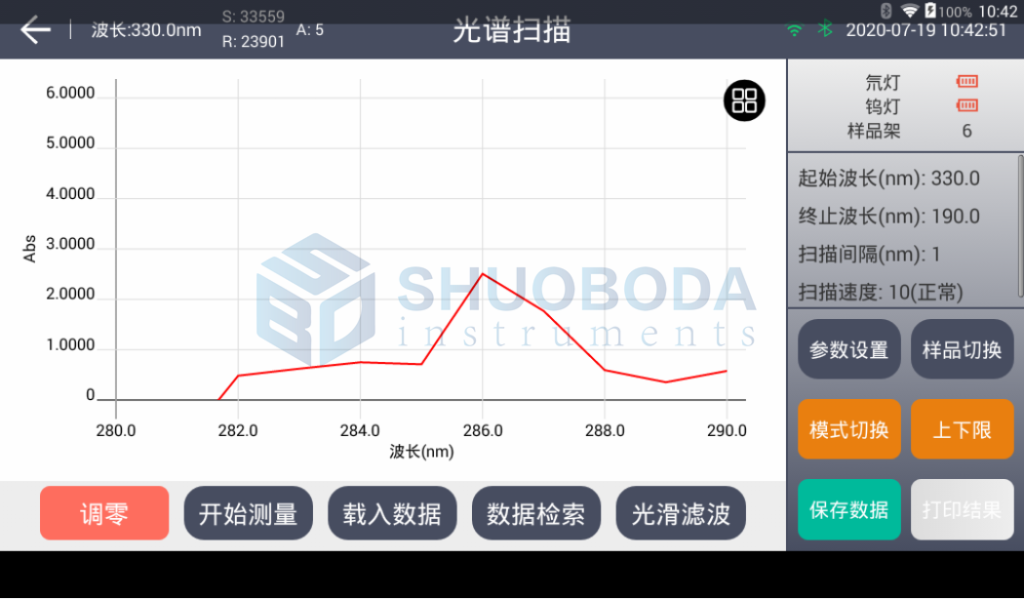
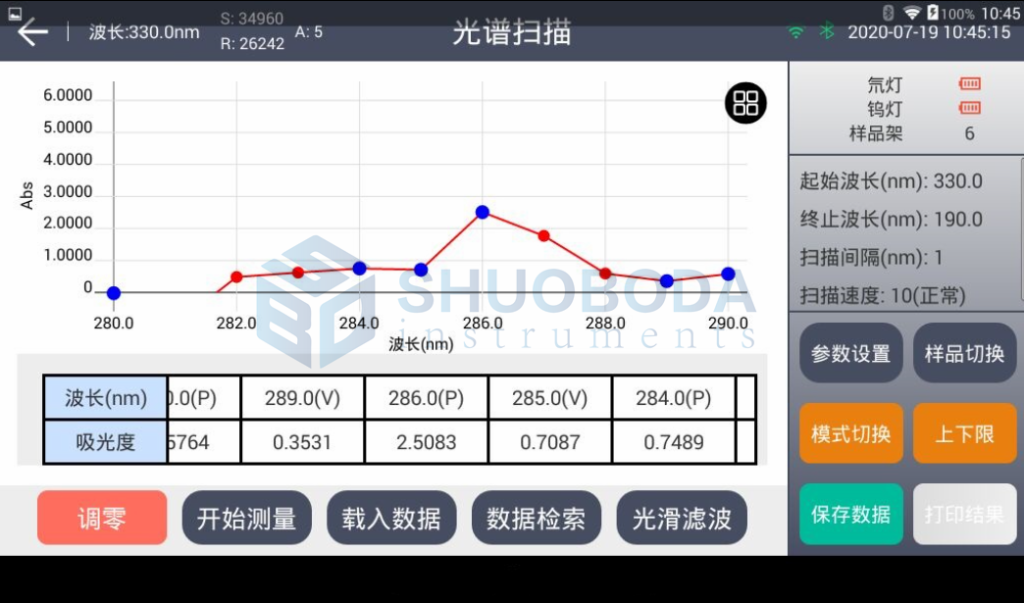
Spectral scanning - the sample needs to draw an absorption peak within a certain wavelength, and automatically give the peaks and troughs of unknown samples (qualitative analysis).
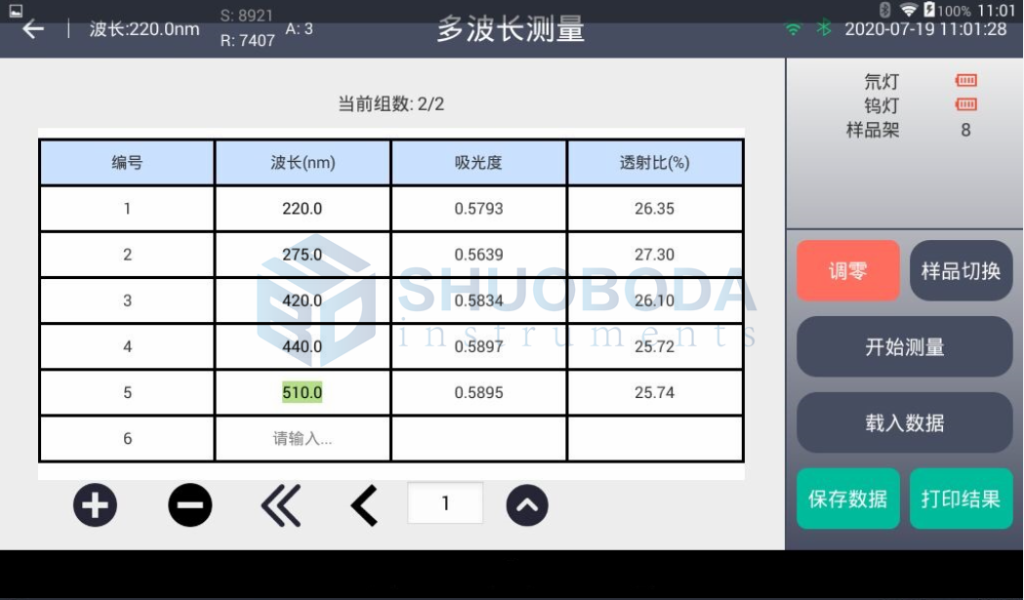
Multi-wavelength measurement - refers to the need to measure the absorbance / transmittance /concentration of a sample at multiple wavelengths
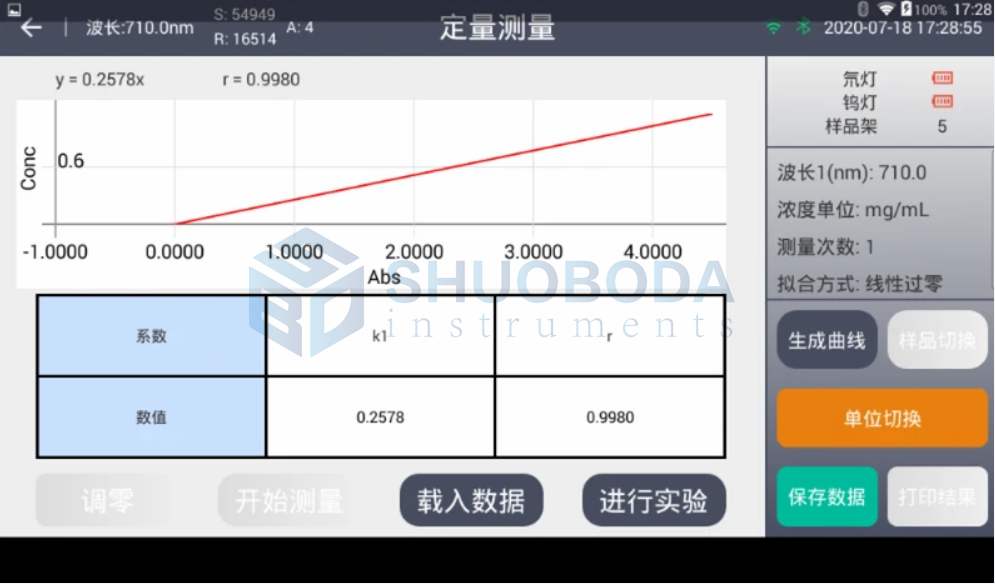
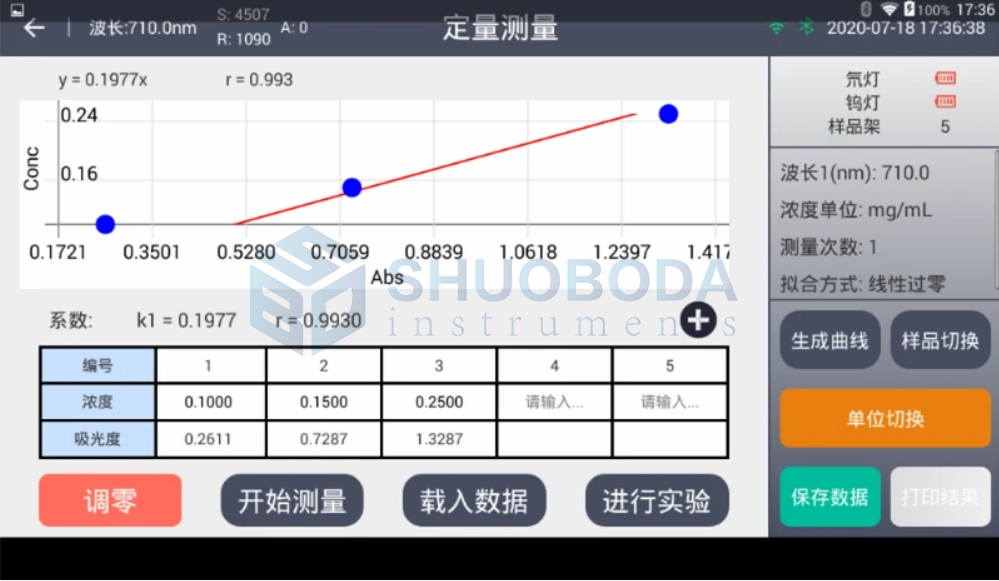
Quantitative measurement - To conduct quantitative analysis of samples, multiple standard samples (more than two) can be used to establish a wavelength absorbance-concentration curve, and the concentration of unknown samples can be obtained from this curve.
Enter the known X, B values to measure the content of unknown samples.
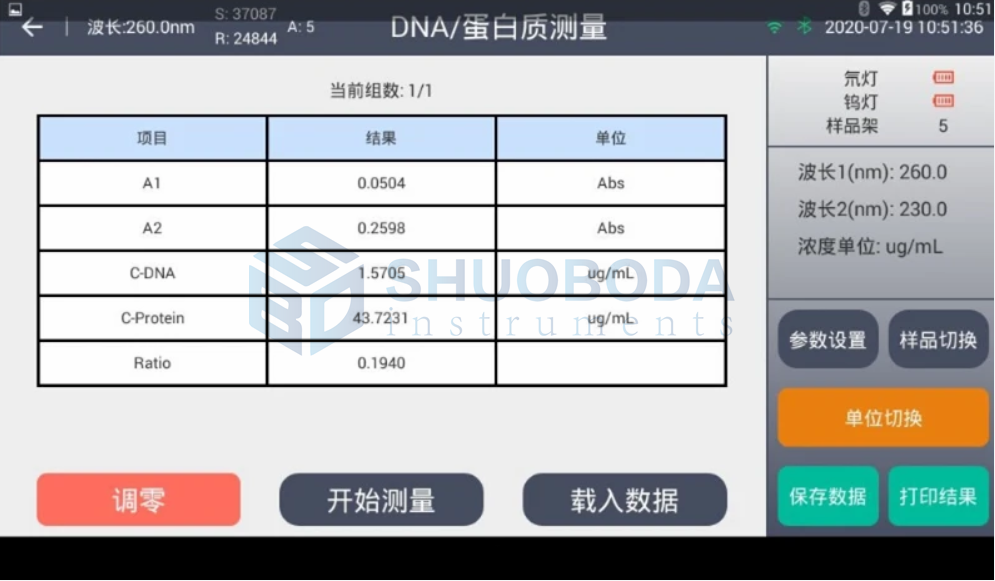
DNA protein measurement
Measurement scheme 1: 260nm 280nm
Measurement scheme 2: 260nm 230nm
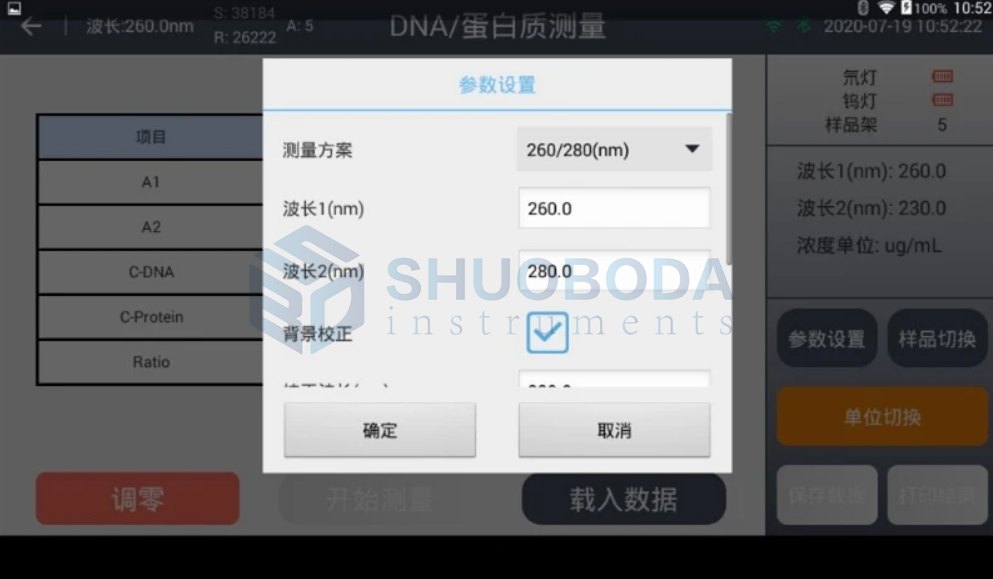
DNA/protein automatic measurement mainly measures absorbance at 260nm/280nm/230nm/320nm, and obtains DNA and protein concentrations according to the calculation formula.
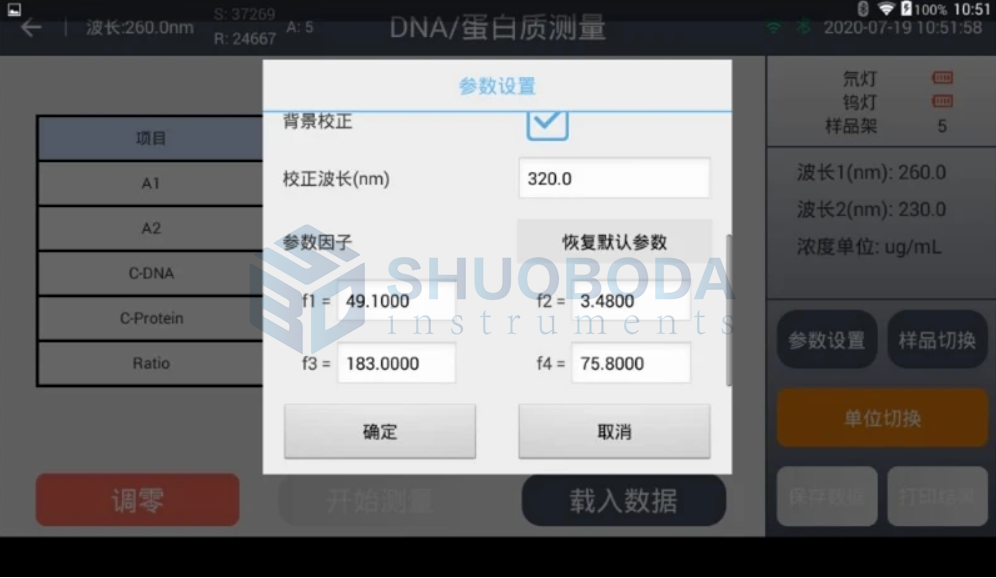
DNA protein measurement results
Experienced service team and strong production support team provide client worry-free order service.


If you are interested in any of our products or would like to discuss a customized order, Please feel free to contact us.
Contact Us